Simulating CFD margin closeout scenarios means testing when losses, trading costs or higher margin requirements could force positions to close. The useful result is not just a trigger price. It is the account equity left after execution, the positions still open and the assumptions behind those figures.
A basic CFD margin calculator estimates the funds needed to support a position. A closeout simulation goes further: it follows the account through adverse conditions, applies the relevant liquidation rules and recalculates after each closure. Start with a transparent calculation before adding historical replay or automated testing.
Start with the account’s actual closeout rule
Do not assume that every CFD account closes positions at the same margin level. Establish the contracting entity, jurisdiction, client classification and account terms before entering a threshold into the model.
For UK retail accounts within scope, the FCA’s CFD margin closeout rules require firms to close open positions as soon as market conditions allow when account net equity falls below 50% of the applicable margin requirement. The rules also require firms to describe how their closeout level is calculated and triggered. That is an account equity test, not a rule that closes every trade after it loses half its opening margin.
Separate three settings: the warning level, the compulsory closeout threshold and any earlier contractual closure condition. Do not build a guaranteed deposit window into the simulation unless the account terms actually provide one.
Check the denominator too. Record whether the closeout calculation uses opening margin, a recalculated requirement or another documented measure. If the trading platform’s displayed margin differs from the margin used for the applicable closeout test, track both. The examples below use a stated 50% threshold; they do not establish availability or protection in your jurisdiction.
Build a consistent account snapshot
Before applying shocks, make the model reproduce the account’s current figures. Capture all positions and account balances at the same timestamp. Mixing yesterday’s balance with current prices can produce a convincing answer to the wrong question.
- Account funds: balance, account currency, floating profit or loss and charges not yet reflected in the balance.
- Positions: direction, quantity, opening price, current closing quote and value per point or contract multiplier.
- Margin: the requirement for each position and the rule for recalculating it.
- Execution conditions: spreads, commissions, financing, conversion rates and the assumed liquidation sequence.
Keep platform terminology consistent. MetaTrader 5’s account reporting definitions express margin level as equity divided by margin, multiplied by 100. Its equity calculation also accounts for items such as credit, commissions and blocked funds. A simplified cash account model should not silently ignore adjustments that appear in the actual account.
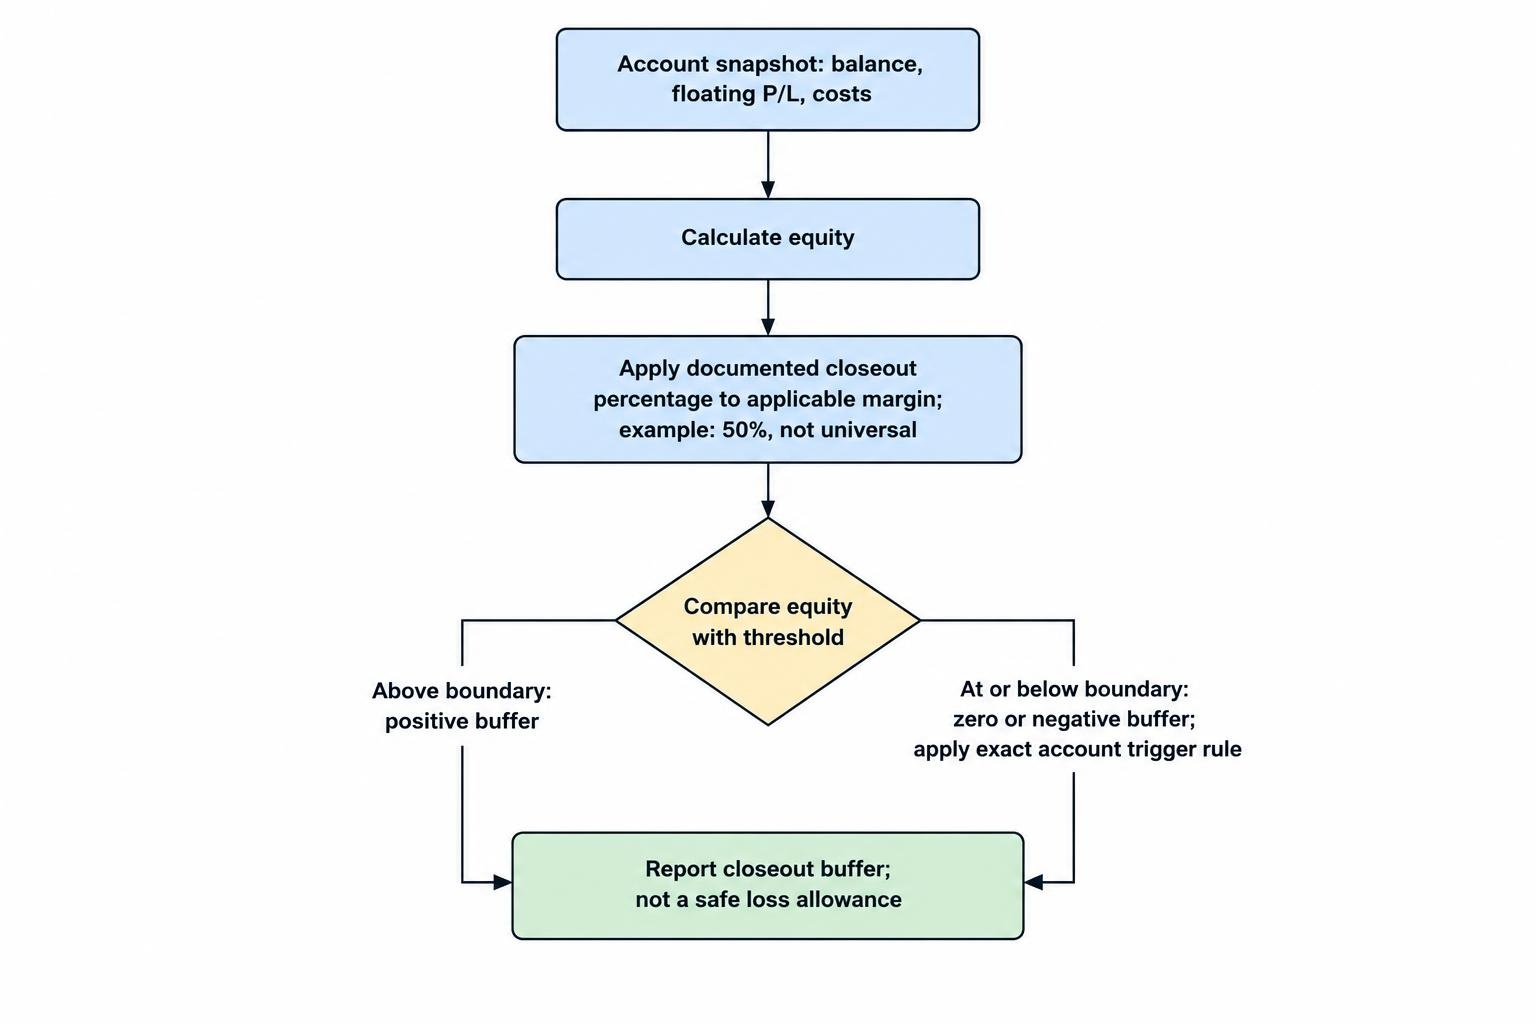
For a model without credit or blocked funds, the working calculations are:
Equity = balance + floating profit or loss − costs not already booked
Margin level = equity ÷ applicable margin × 100
Closeout buffer = equity − (closeout percentage × applicable margin)
Enter the closeout percentage as a decimal in the last calculation: 50% becomes 0.50. A positive buffer is the distance from the modelled boundary, not a safe loss allowance. If applicable margin is zero, report the ratio as not applicable rather than dividing by zero.
Worked example: one index CFD
Consider a hypothetical long index CFD opened at 20,000, with exposure of £1 per index point. The account has £1,500 equity immediately after entry and requires £1,000 margin.
For this first calculation, hold margin constant, exclude further costs and assume no other positions. These are modelling assumptions, not universal account terms.
With a 50% closeout threshold, the equity boundary is £500. The starting buffer is therefore £1,500 − £500 = £1,000. Each point of adverse movement reduces equity by £1, so a fall of 1,000 points takes the account to the boundary.
| Index closing quote | Floating profit or loss | Account equity | Margin level |
|---|---|---|---|
| 20,000 | £0 | £1,500 | 150% |
| 19,750 | −£250 | £1,250 | 125% |
| 19,500 | −£500 | £1,000 | 100% |
| 19,250 | −£750 | £750 | 75% |
| 19,000 | −£1,000 | £500 | 50% |
The last row marks the mathematical boundary, not a guaranteed execution price. Apply the account’s precise trigger condition when deciding whether equality triggers closure or whether equity must fall below it.
Notice what the example does not say: the account does not reach its boundary after losing 50% of its £1,500 starting equity. It reaches it after losing £1,000, because the threshold is measured against margin.
Now introduce £40 of additional charges before closeout. The remaining price loss buffer becomes £960, moving the modelled boundary to 19,040. Do not subtract charges again if they already sit in the balance or floating result.
Stress more than the underlying price
Wider spreads and accumulated costs
Run a spread shock separately from an underlying price shock. For a long position, use the quote available to sell; for a short position, use the quote available to buy. A midpoint price alone cannot represent the cost of closing both directions.
Keep the calculation internally consistent. If the position is already valued using its closing quote, do not deduct the same spread again as a separate charge.
For positions held across financing periods, enter the applicable charges at their booking times. CFD overnight financing calculations can supply those inputs. Run separate paths for an immediate market move and a slower decline with several financing debits; identical final prices need not produce identical equity.
Higher margin requirements
Test a higher margin requirement while keeping price unchanged. In the worked example, equity at 19,250 is £750. With £1,000 margin, the margin level is 75%. If the scenario raises applicable margin to £2,000, the ratio falls to 37.5%.
Under the assumed 50% rule, that change creates a breach without another point of market loss. Use an actual notified margin schedule where available. Otherwise label the increase as a hypothetical stress, not a forecast or a statement of the provider’s policy.
Currency conversion and joint losses
Where position results or margin originate in another currency, shock the conversion rate as well as the instrument price. Convert both figures into account currency before comparing equity with the closeout threshold.
For several positions, apply joint shocks. Test what happens if trades intended to offset each other both lose money, or if one market stops updating while another continues moving. These are designed stress paths, not claims about how often those events occur.
Separate the trigger from the execution price
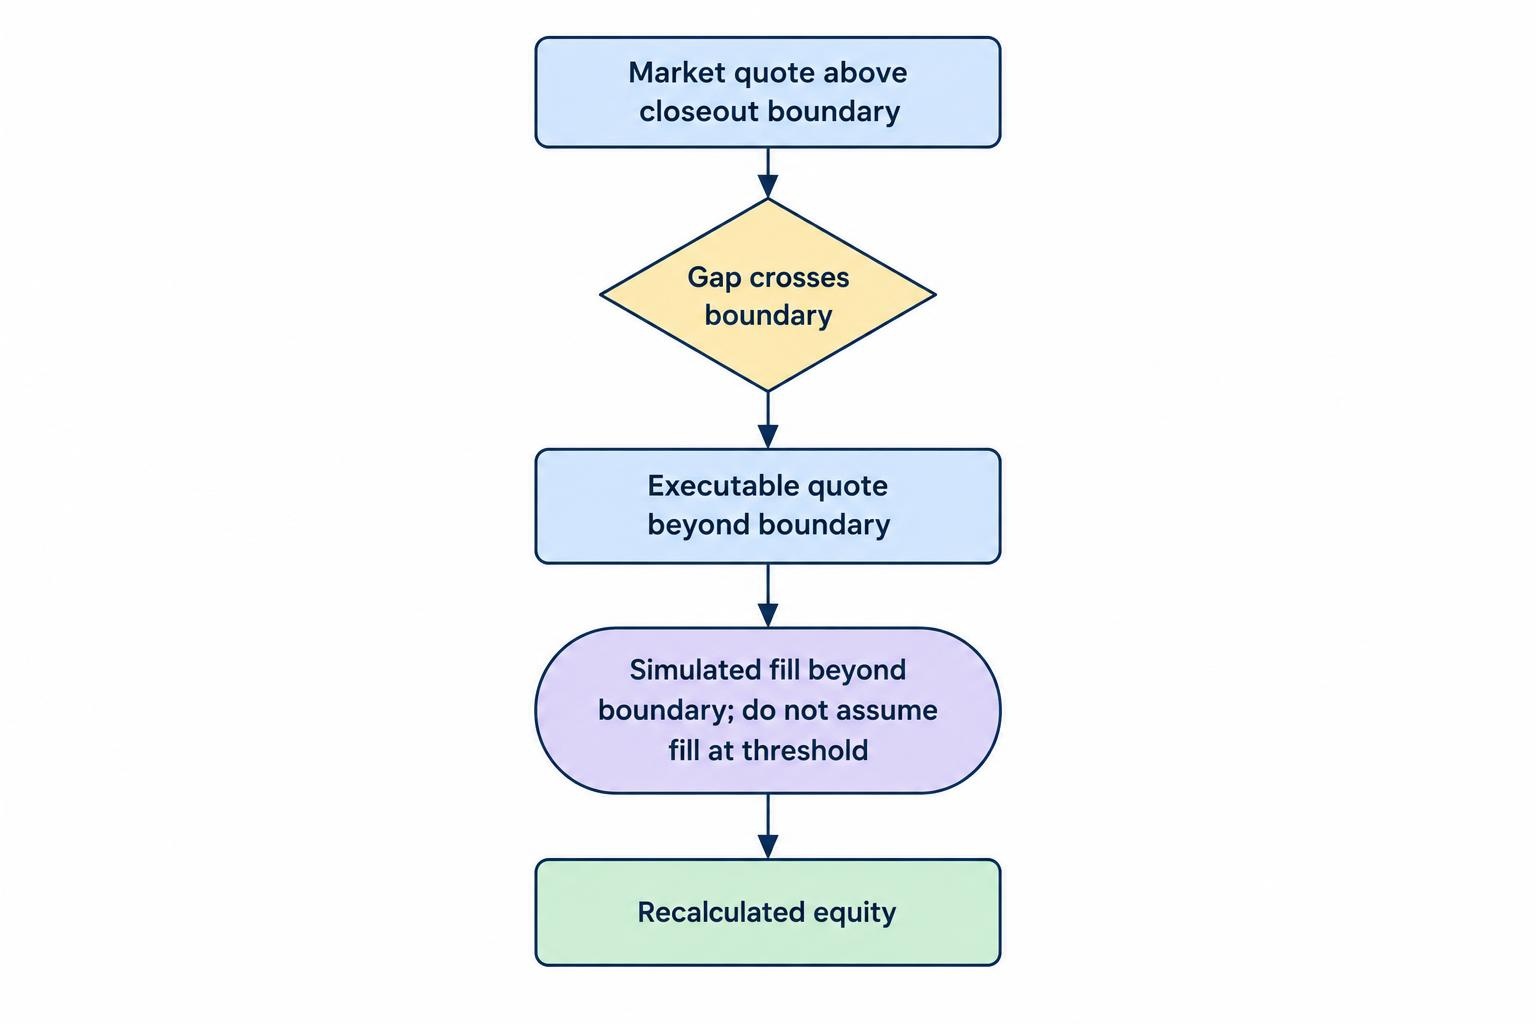
A smooth price ladder assumes the market supplies every intermediate quote. Add a gap scenario that jumps across the boundary.
In the index example, a move directly from 19,100 to an executable quote of 18,800 takes equity from £600 to £300 before further costs. The model should record the boundary crossing separately from the eventual fill. Filling automatically at 19,000 would erase the very risk the gap test is meant to measure.
Stops also need separate treatment. ESMA’s guidance on guaranteed stops and margin closeout states that account closeout can occur before a position’s guaranteed stop is reached. It also recognises that gaps can prevent margin closeout without price slippage. Include the interaction between account liquidation and any guaranteed stop rather than assuming one replaces the other.
Negative balance protection is another distinct control. In Australia, ASIC’s retail CFD protections limit covered retail clients’ CFD losses to funds in their CFD trading account. That does not preserve the starting deposit or promise execution at the closeout boundary.
Where protection applies, record the raw execution result and any protection adjustment separately. Do not conceal an overshoot by forcing simulated equity to stop exactly at the threshold.
Simulate the liquidation sequence
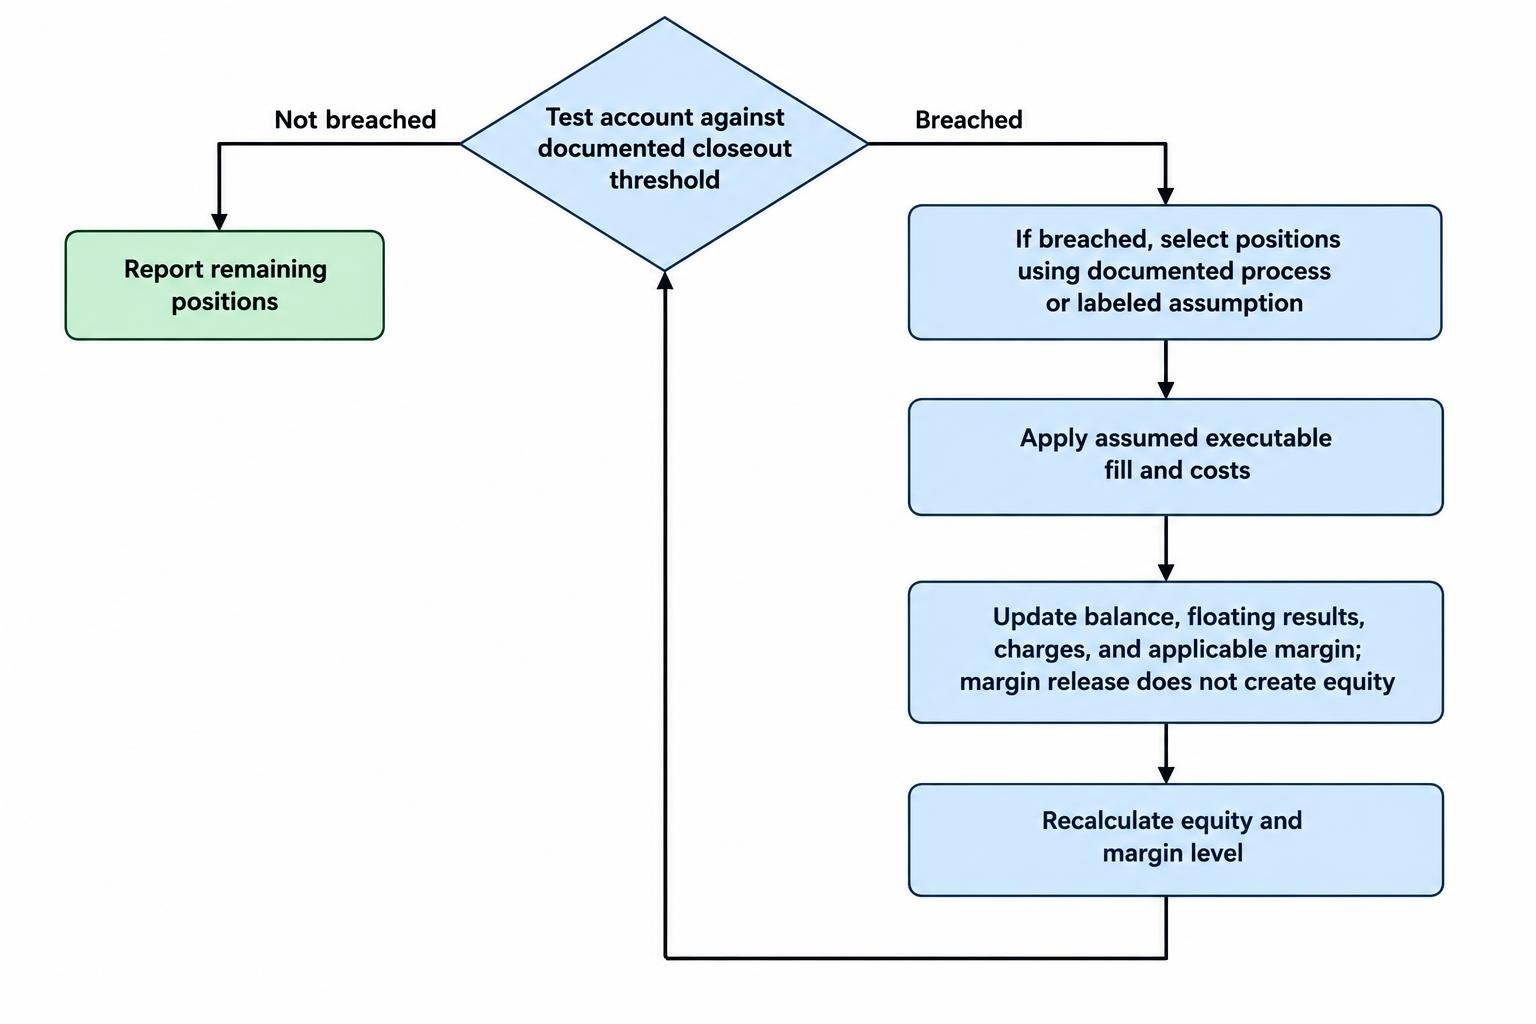
Finding the first breach is only half the task. The simulator must then decide what closes, at which price and whether another closure is necessary.
Use the provider’s documented process where available. If the sequence is unclear, compare alternative assumptions, including full liquidation and selected position closures. Label them clearly rather than presenting one as established behaviour.
Consider a hypothetical account with £900 equity and £2,000 applicable margin. Its margin level is 45%, below the assumed 50% threshold. Suppose the simulation closes a position that releases £800 margin, with £20 of additional execution cost.
The remaining account has £880 equity and £1,200 margin. Its margin level becomes approximately 73.3%. Under a model that stops liquidation once the threshold is restored, no further closure would be required at that instant.
Releasing margin does not create equity. Before additional costs or price movement, realising a floating loss moves it into the balance; it does not deduct the loss a second time.
After every simulated fill, update the balance, remaining floating results, charges and applicable margin. Then test again. Where margin depends on offsets between positions, recalculate the remaining portfolio instead of subtracting a fixed amount.
Choose software that exposes its assumptions
A spreadsheet is suitable for checking a few transparent scenarios. Use a price replay engine or trading tester when the order of quotes, charges and closures becomes important. Either approach should expose its inputs and produce an event log.
Platform settings deserve inspection. MetaTrader 5’s advanced testing settings allow custom margin and closeout settings expressed as equity amounts or margin level percentages. Its documentation describes closing all positions at the configured stopout level, which may differ from the liquidation sequence you need to model. It also states that margin control is not performed in its profit calculation in pips mode, making that mode unsuitable for this test.
Validate the initial account state before running a long replay. Compare modelled equity, margin and floating results with the platform snapshot. Resolve unexplained differences before trusting a trigger price.
Then check quote handling and fill assumptions through CFD execution quality analysis. A simulator that matches opening figures can still produce misleading results if it assumes every closure occurs instantly at the displayed quote.
Test boundary cases deliberately: just above the threshold, exactly on it, just below it, a gap through it and a financing debit that creates a breach. Preserve each test’s account terms, data timestamp and settings so the result can be reproduced.
Use the results to set an earlier decision point
A useful report shows the lowest equity, smallest closeout buffer, first breach time, assumed fills, total costs and remaining positions. Keep results from smooth moves, gaps and higher margin requirements separate.
Report a breach frequency only when the scenario set supports that interpretation. Three breaches among ten handpicked stress cases does not establish a 30% real market probability.
Use the results to compare position sizes, concentration and earlier intervention levels. Position limits and exposure alerts can turn those decisions into monitoring controls without treating compulsory closeout as the intended exit.
The question is not simply, “At what price will the account close?” It is, “Under which assumptions does it close, what happens during execution, and how much room remains before that process begins?” A useful simulation answers all three.