A CFD overnight financing calculator estimates the charge or credit for keeping a position open beyond the provider’s daily funding cutoff. Its useful output is not just tonight’s fee. It should also show the estimated cost across your intended holding period, the effect of weekends and holidays, and how financing changes the trade’s break-even point.
The arithmetic is straightforward. Matching the calculator to the contract is harder. A useful calculator within your CFD trading software should make its assumptions visible rather than produce a precise-looking figure from an unexplained rate.
Calculate financing on the right position value
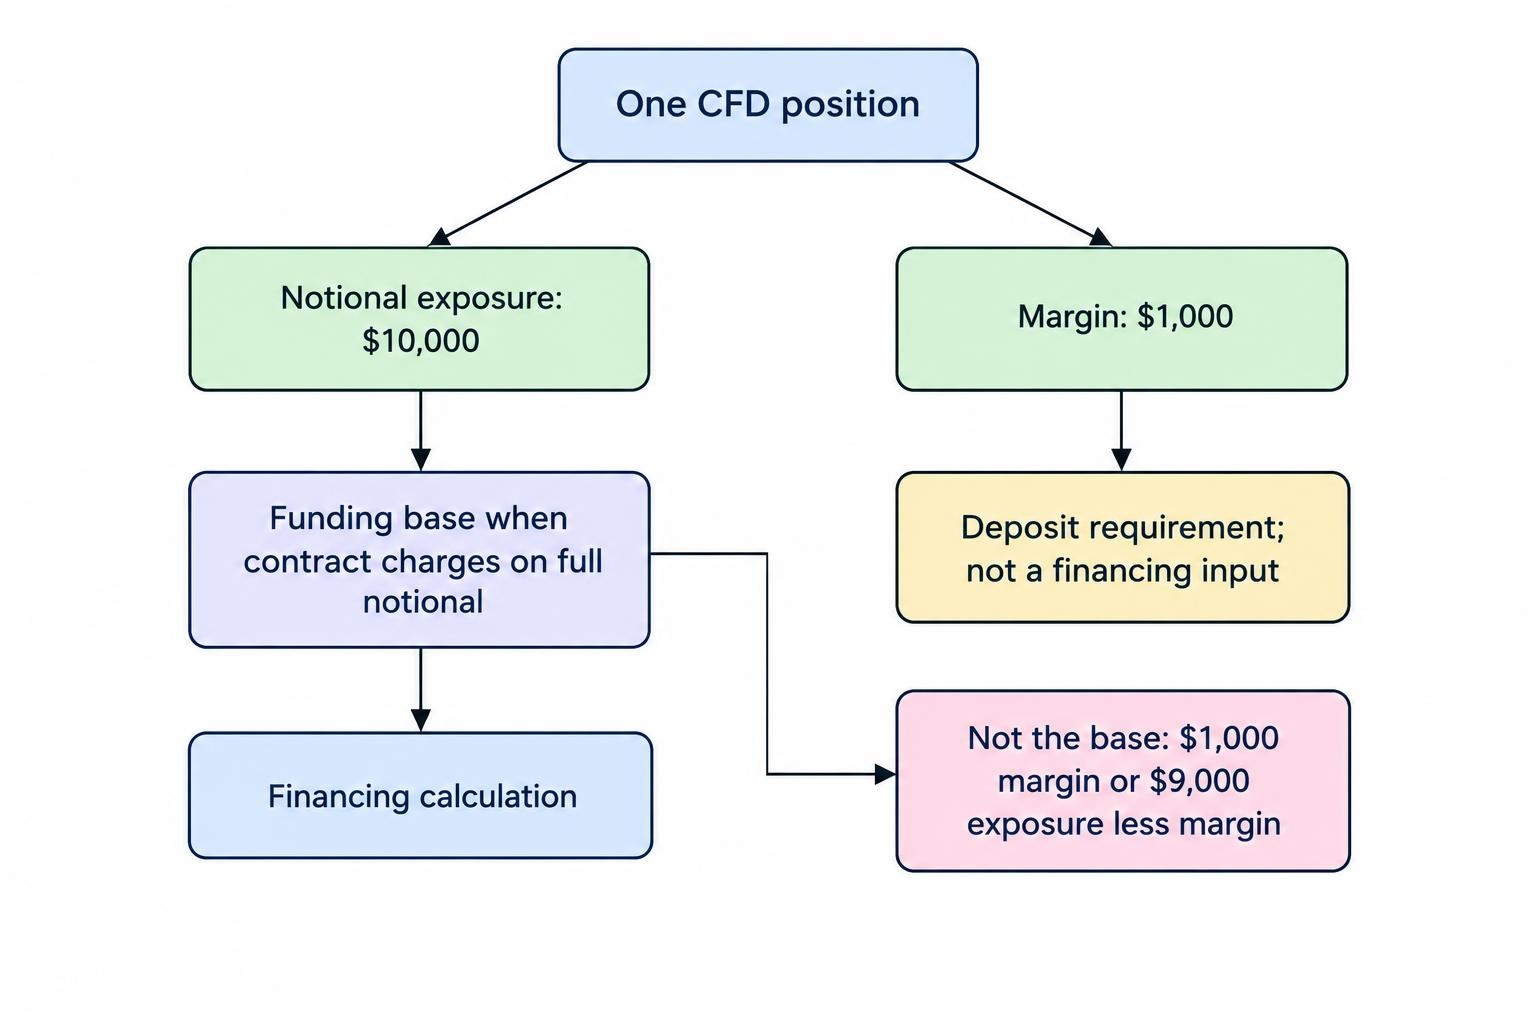
The starting point is the position’s notional value: the market exposure represented by the contract. That is different from the margin deposited to open it.
For a share CFD, notional value generally means the number of shares represented multiplied by the applicable share price. For an index CFD, it means the index level multiplied by the cash value per point and the number of contracts. Check whether your platform’s displayed contract size already includes that multiplier before multiplying it again.
Overnight funding commonly applies to the full exposure, not just the margin or an assumed borrowed balance. Charging on full exposure without offsetting money held in the account was one of the disclosure issues identified in the FCA review of CFD pricing and value. A calculator that asks only for your deposit can therefore give a badly understated estimate.
Suppose a position represents $10,000 of exposure and requires $1,000 of margin. If its terms charge financing on the full notional, the calculation starts with $10,000. Neither $1,000 nor $9,000 is the correct funding base.
The overnight financing formula
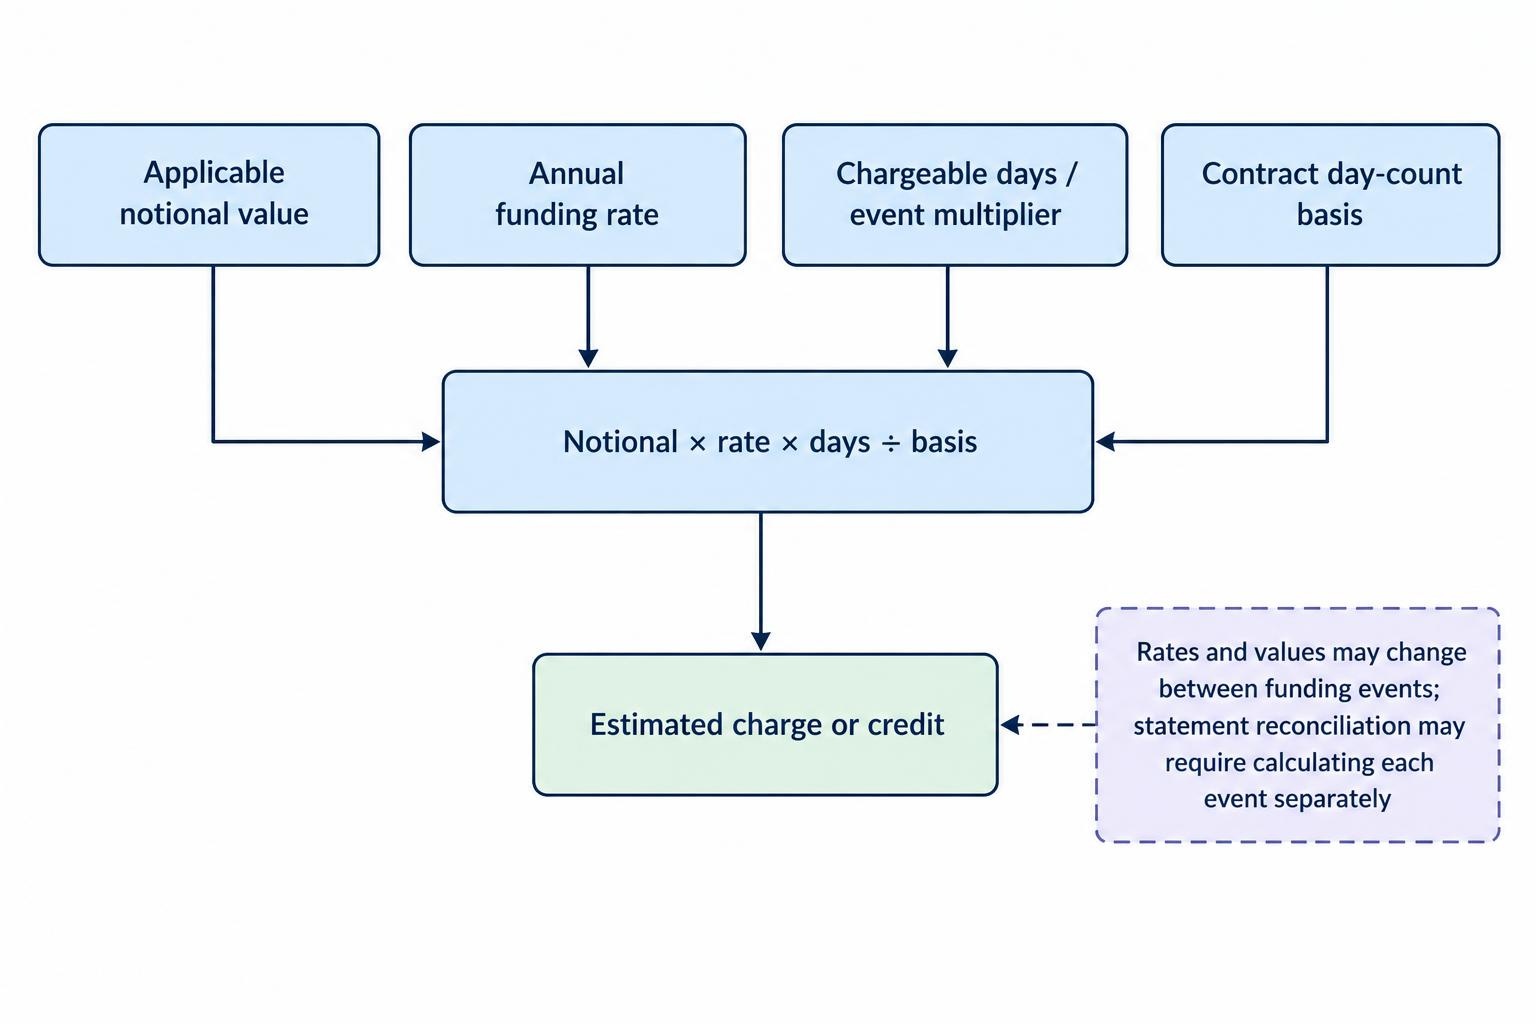
Where the contract uses an annual percentage rate, a basic estimate is:
Financing charge = applicable notional value × annual funding rate × chargeable days ÷ day-count basis
Enter an 8% annual rate as 0.08. Use the contract’s stated day-count basis, such as 360 or 365, rather than choosing whichever produces the smaller answer. The ATO worked CFD financing example illustrates an annual rate applied to daily closing position value using a 365-day denominator.
If the provider publishes a benchmark plus a markup, add them only when that is the stated method. A hypothetical 5% benchmark plus a 3 percentage point markup produces an 8% annual funding rate. Adding another markup to an already inclusive rate would count the same cost twice.
For a forward estimate, you can hold the rate and position value constant. For reconciliation against an account statement, calculate each funding event using the applicable value, rate and day multiplier, then add the results. These are different tasks and should be labelled separately.
Worked example: a $10,000 long position
Assume a long CFD has $10,000 of exposure, an inclusive annual funding rate of 8%, and a 365-day basis. These are illustrative inputs, not a current provider quote. Assume the value and rate remain unchanged throughout each period.
| Chargeable days | Calculation | Estimated debit |
|---|---|---|
| 1 | $10,000 × 0.08 × 1 ÷ 365 | $2.19 |
| 7 | $10,000 × 0.08 × 7 ÷ 365 | $15.34 |
| 30 | $10,000 × 0.08 × 30 ÷ 365 | $65.75 |
| 90 | $10,000 × 0.08 × 90 ÷ 365 | $197.26 |
Using a 360-day denominator instead would produce $66.67 over 30 chargeable days. That difference comes from the calculation convention, not a change in the headline rate.
Keep the margin calculation separate. At $1,000 of initial margin, the illustrative $65.75 monthly charge equals about 6.58% of that margin. With $2,000 of margin and unchanged exposure, it equals about 3.29%. The dollar charge remains the same. CFD margin calculators address the deposit requirement; financing calculators address the cost of maintaining exposure.
Long and short positions need separate rates
Do not assume a short position earns the exact opposite of the long position’s funding charge. The calculator needs separate inputs for buying and selling, plus an unmistakable debit or credit label.
Funding rates vary between providers and underlying assets, and some short positions receive credits. Matched long and short positions can still attract charges on both sides. These issues remain part of the FCA’s October 15, 2026 findings on CFD funding practices. Equal market exposure in opposite directions does not necessarily mean equal and opposite financing.
Consider a hypothetical short contract whose terms calculate a credit as benchmark minus markup. A 5% benchmark minus a 3 percentage point markup leaves a 2% annual credit before any other applicable charges. If the benchmark were 1% with the same markup, the result would instead be a 2% annual debit.
That example illustrates one method, not a universal short CFD formula. Use the provider’s actual sell rate and check for any separate stock borrowing charge. A calculator should let you enter such a charge separately rather than conceal it inside an unexplained net figure.
Count funding events, not just nights away
A holding period entered as “three days” is incomplete without the funding schedule. Check the daily cutoff, its time zone, the treatment of daylight saving changes, and any weekend or holiday adjustments. The calendar is not a fee schedule.
The contractual charging method matters more than a calculator’s default settings. Funding documentation should set out how interest is calculated and when it applies; these checks are covered in ASIC’s CFD guide on fees and interest. Record those terms alongside the rate you enter.
If an instrument’s schedule assigns three chargeable days to one funding event, the calculator should apply a multiplier of three to that event. It must not then add the same weekend days again. In the worked example, a three-day adjustment would be approximately $6.58.
Do not hard-code Wednesday or Friday as the triple funding day for every instrument. Make the schedule an input. A reliable date-based calculator should show the funding events it has counted, not just the total.
Check timing around the planned exit, too. If your estimate assumes the position closes before a cutoff, make that assumption explicit. Do not treat an intended closing time as confirmation that the position will actually be closed.
Match the calculator to the CFD’s funding model
A calculator built for cash share CFDs should not automatically apply the same formula to currency, commodity or expiry-based contracts. Start with the exact instrument name and contract type, not just the underlying market.
For currency CFDs, funding reflects the interest rate relationship between two currencies as well as provider adjustments. That differs from simply applying one currency’s benchmark plus a markup to every position. CME Group’s comparison of FX financing models describes the distinction between daily CFD swaps and financing embedded in FX futures prices.
If your platform quotes a swap in points, a cash amount per lot, or a daily percentage, use a calculator designed for that quotation. Check the point value, lot definition and charge currency. Never enter a daily percentage into an annual rate field.
For a CFD referencing a futures contract, check whether financing is charged separately or reflected through another pricing adjustment. An absent overnight debit is not enough to establish that carrying the position costs nothing. Avoid adding an assumed annual funding charge without checking the contract.
Turn the estimate into a break-even calculation
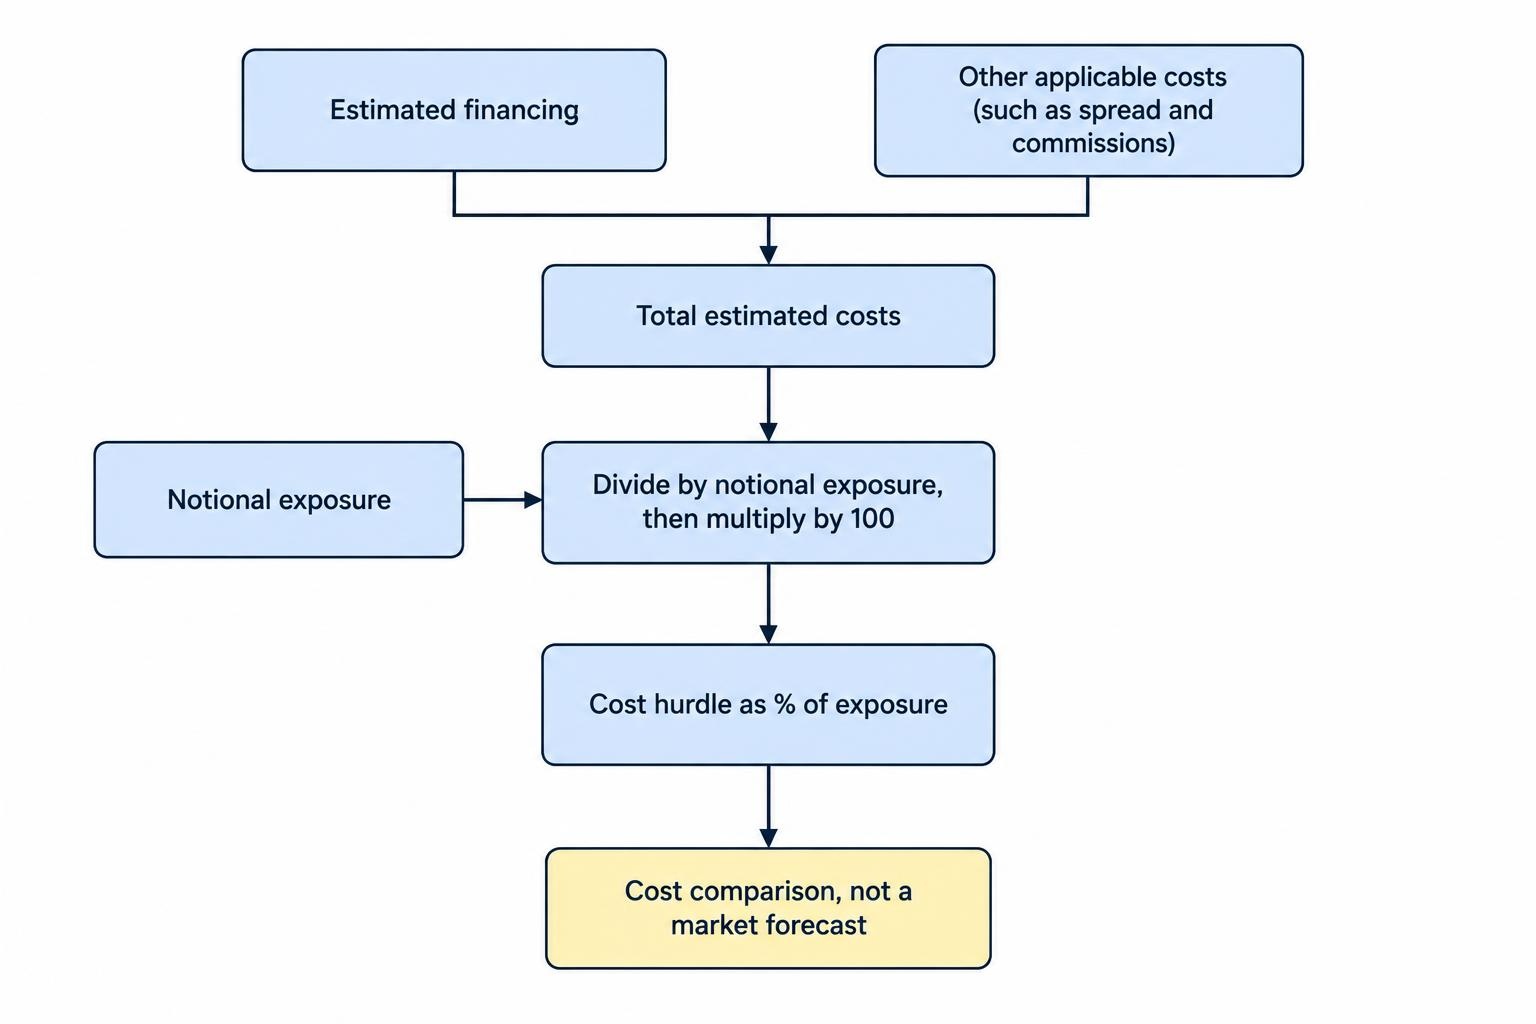
A financing estimate becomes more useful when you compare it with the price movement needed to cover costs. Keep this calculation separate from any forecast of where the market will go.
Using the $10,000 example, assume seven chargeable days produce $15.34 of funding. Add a hypothetical $20 combined allowance for entry and exit spread and commissions. The total estimated cost is $35.34.
Cost hurdle as a percentage of exposure = total estimated costs ÷ notional exposure × 100
Here, the hurdle is approximately 0.35% of exposure. At 30 chargeable days, the $65.75 financing estimate plus the same $20 allowance produces an $85.75 cost hurdle, or about 0.86%.
Those figures assume constant exposure, no other adjustments and the stated trading cost allowance. They are not a complete prediction of net profit. Add currency conversion costs, borrowing charges or other contract adjustments where applicable, without counting anything twice.
Run more than one holding period. Comparing seven, 30 and 90 chargeable days shows how much the estimate depends on a timely exit. If a trade’s rationale requires a small price move but several months of funding, that mismatch deserves attention before entry.
What useful calculator software should show
A browser calculator can handle a quick estimate. A spreadsheet can make assumptions easier to inspect. An integrated platform tool may reduce manual entry, but it still needs to reveal the rate, valuation and schedule it uses. Integration is not proof of accuracy.
Look for these controls when comparing calculators:
- Transparent inputs: contract size, direction, funding base, rate, denominator and charge currency.
- Visible timing: cutoff time, time zone and the day multiplier for each funding event.
- Separate outputs: funding debits, credits and other charges rather than one unexplained total.
- Traceable data: a timestamp and an indication of whether rates were entered manually or imported.
- Exportable records: assumptions and calculations that you can compare with the account statement.
Before paying for software, establish which of those functions you need. A transparent spreadsheet may be enough for occasional estimates. Monitoring many open positions may justify automated imports and a portfolio funding total. Broader platform features belong in a CFD trading platform comparison; the financing tool itself should first pass the arithmetic and disclosure checks.
Prefer software that flags missing information. An empty holiday schedule or unknown rate should produce a warning, not a reassuring zero.
Check estimates against actual charges
Before relying on a calculator, reconcile one completed funding event. Record the instrument, direction, position size, applicable valuation price, funding rate, denominator and day multiplier. Compare the result with the corresponding statement entry in the same currency.
Start with an ordinary one-day adjustment, then check a weekend or holiday adjustment. This makes it easier to distinguish an arithmetic problem from a scheduling problem.
If the figures disagree, investigate one input at a time. Check whether the provider used a different valuation price, changed the rate, applied another day multiplier or converted the charge into the account currency. Also check whether the statement combines financing with another adjustment.
Rounding can explain small differences. Seven daily amounts rounded to $2.19 total $15.33, whereas rounding the full seven-day calculation produces $15.34. Match the provider’s rounding sequence before treating a cent difference as an error. Larger discrepancies deserve a documented explanation.
For longer forecasts, save a base case and an adverse case with higher funding costs or a later exit. Refresh the estimate when rates, position size or the holding plan changes.
Use the result as a cost estimate, not a safety signal
A small funding charge does not make a CFD position low risk. Financing sits alongside spread, commission and market losses, and can reduce profits or worsen losses. The ASIC Moneysmart guidance on CFD costs and risks makes that distinction clear.
The most useful calculator leaves you with an auditable answer: what you expect to pay or receive, which assumptions produced that figure, and what could change it. A number without those details is not much of a budget.