Comparing CFD price feeds and execution quality means checking two things separately: whether the quoted prices are reasonable, and whether orders receive reasonable fills. A tight spread answers neither question on its own. The useful evidence sits in timestamped bid and ask quotes, order records, charges and rejected requests.
When assessing CFD trading software, prioritize the ability to export that evidence. An attractive chart cannot show how much a delayed fill cost, whether a quote was stale, or what happened to an order that never completed. Compare measurable outcomes under similar conditions, rather than screenshots or advertised minimum spreads.
Separate Price Quality From Execution Quality
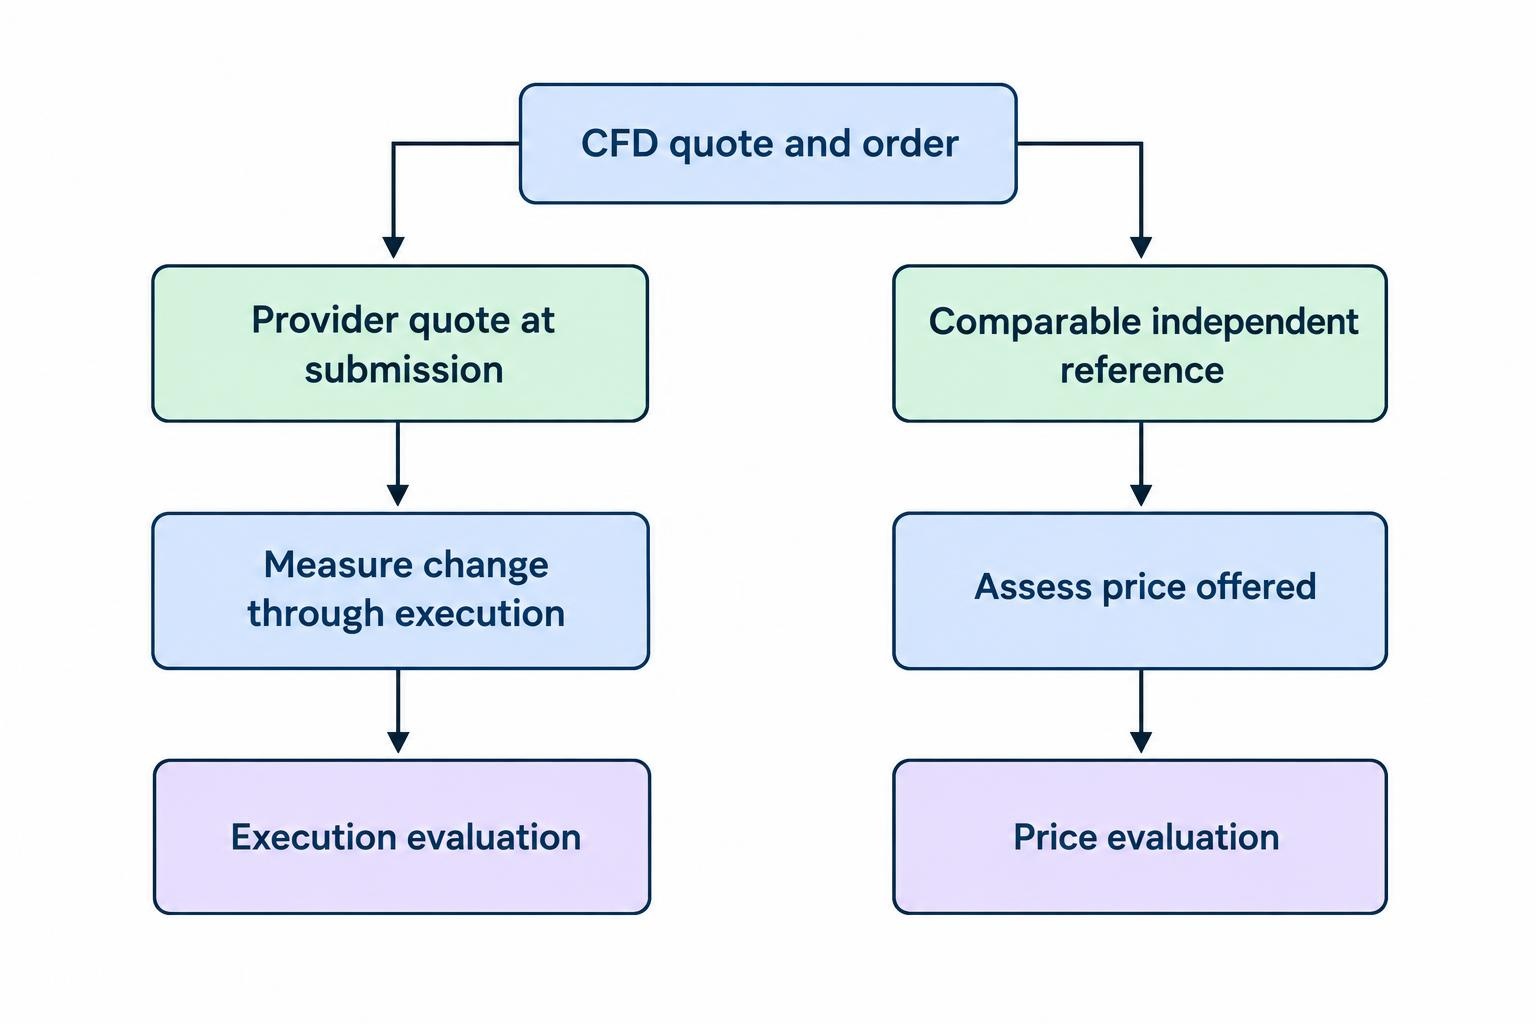
A price feed supplies quotes. Execution turns an order into a trade, potentially after the market has moved. Keep these stages separate in your analysis: a platform might display reasonable prices but deliver slow fills, or execute quickly against prices that are consistently less favorable than comparable quotes.
Start with the provider’s pricing methodology. Identify the underlying reference, any markup, the treatment of trading outside normal market hours, and the conditions under which prices can change. Transparent pricing based on relevant market references forms part of ESMA’s supervisory guidance on CFD pricing and execution. Treat that document as regulatory context, not a substitute for checking your account’s current terms.
Use two benchmarks where possible. The provider’s own quote helps measure what happened between submission and execution. An independent, comparable reference helps assess the price offered in the first place. Passing one check does not automatically mean passing the other.
Compare the Same Instrument and Price Basis
Before measuring differences, confirm that the feeds represent the same exposure. Similar market names are not enough. Record whether the CFD references a cash market, a dated futures contract or another published benchmark. Check the quote currency, contract value, trading session and any adjustment method.
Build a short comparison sheet before collecting data:
| Comparison field | What to match or record | Why it matters |
|---|---|---|
| Underlying reference | Cash market, benchmark or exact futures expiry | A different reference can make a price gap misleading. |
| Price side | Bid against bid; ask against ask | A midpoint is not the same benchmark as an executable quote. |
| Contract economics | Currency, units and value per point | Identical lot counts may represent different exposures. |
| Time basis | Time zone, timestamp meaning and precision | Misaligned observations distort the comparison. |
| Session and adjustments | Market hours, expiry changes and adjustment dates | These conditions need separate treatment in the dataset. |
Do not label every difference an execution problem. First establish whether the comparison itself is valid. If you cannot explain the relationship between two instruments, exclude that pair until the documentation resolves it.
Include data access in your CFD platform comparison. Check whether each platform exports bid and ask history, individual fills and rejected orders. Without those records, the comparison may stop at what the interface happens to display.
Build an Order Record You Can Audit
Create one record for each submitted order, then attach its individual fills and status changes. Capture the instrument, direction, quantity, order type, account type, submission time, displayed bid and ask, fill prices, filled quantity, commission and final status. Preserve the order identifier so you can reconcile the export with account statements.
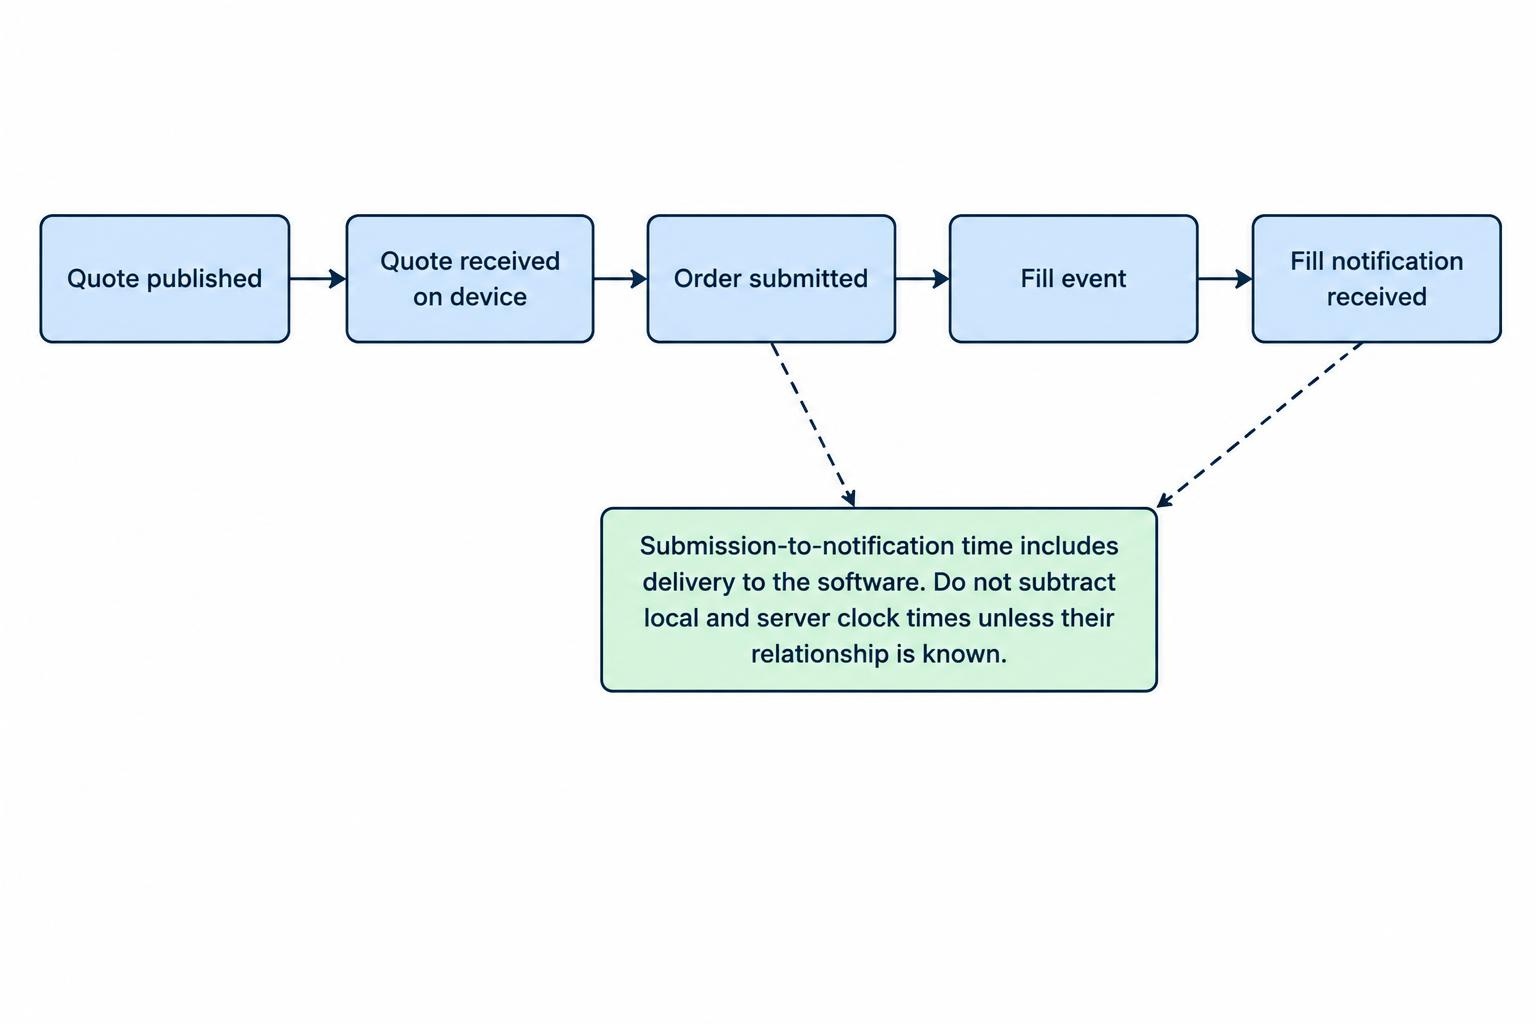
Keep different timestamps in separate fields. A quote’s publication time, its arrival on your device, the order’s submission time and the fill notification’s arrival are different events. Name each field plainly; a column called “time” invites confusion.
Where FIX records are available, the FIX execution report specification distinguishes individual fill price and quantity from cumulative quantity, and defines TransactTime as the time of the event represented by the report. Check which fields your connection actually supplies rather than assuming every timestamp means execution time.
For local elapsed measurements, use the same timing system at both ends. Do not subtract a local submission timestamp from a server timestamp unless their clock relationship is known. Likewise, label submission-to-notification time honestly: it includes the wait for the result to reach your software, not just processing inside the provider.
Measure Feed Quality Beyond the Minimum Spread
Collect spread observations throughout the sessions you use. Record the median, a high percentile such as the 95th, and the largest observed spread. Keep ordinary trading, scheduled announcements, session changes and disrupted periods in separate groups.
For a time weighted average spread, multiply each observed spread by the time it remained in effect, add those values, then divide by the observation period. This prevents a burst of rapid updates from dominating the average simply because it produced more records.
Check quote differences and freshness
For matched instruments, compare synchronized midpoint observations to examine feed differences without mixing bid and ask sides. Retain the original quotes so you can investigate unusual readings. Summarize both the typical difference and its range rather than selecting the largest gap for a screenshot.
Define a stale quote flag before running the comparison. For example, flag periods when one feed stops updating while the reference continues moving beyond a chosen tolerance. Investigate those flags against connection logs and market conditions. An unchanged price alone is not enough evidence of a fault.
If source timestamps are unavailable, describe the result as a comparison of locally received feeds. That is still useful, but it does not establish which upstream system introduced the delay.
Calculate Slippage With a Consistent Sign
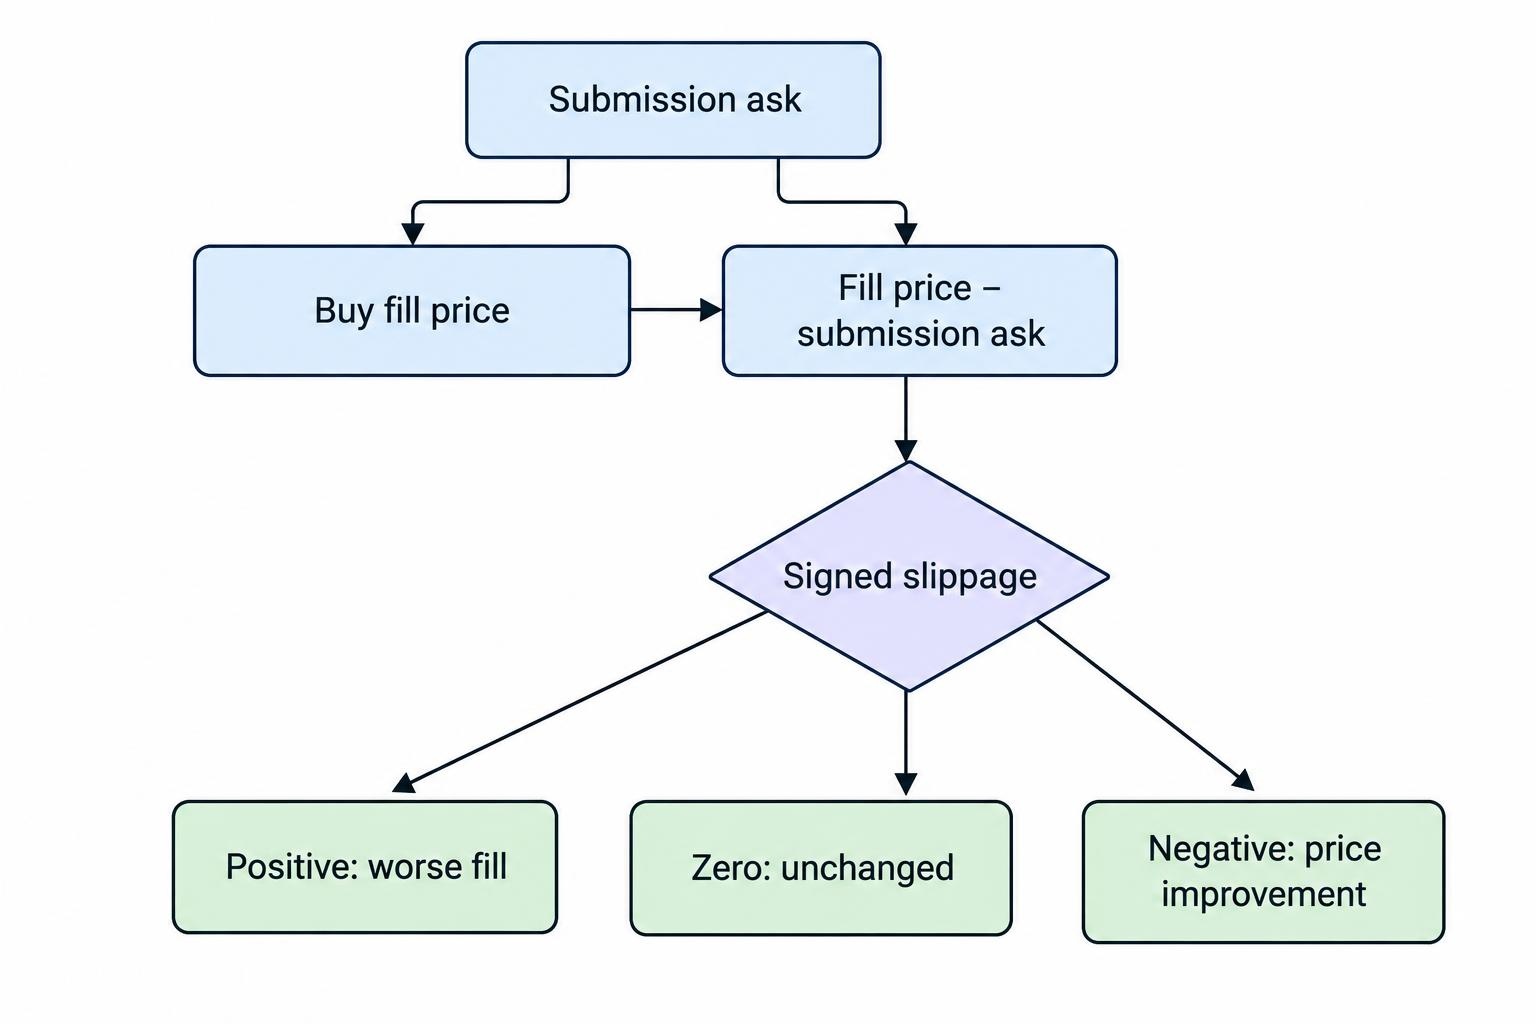
For a market buy, compare the fill with the ask recorded at submission. For a market sell, compare it with the bid. Avoid using the midpoint for this calculation unless you deliberately want a measure that also includes spread cost.
A practical convention is to calculate signed adverse slippage:
Buy: fill price minus submission ask.
Sell: submission bid minus fill price.
Under this convention, a positive number means a worse fill, a negative number means price improvement, and zero means no change. State the convention in every report because labels such as “positive slippage” can otherwise mean the opposite.
Suppose the submission ask is 20,000.5 and a buy fills at 20,000.8. Adverse slippage is 0.3 points. If the same order fills at 20,000.3, the result is minus 0.2 points, representing improvement. These are illustrative calculations, not measured platform results.
For an order filled in several parts, calculate the average fill price weighted by quantity. Keep each partial fill as well: the average can hide a small early fill followed by a much worse completion.
Report the frequency and monetary size of favorable and unfavorable outcomes separately. Do not expect a mandatory 50:50 split. Instead, compare similar order types, sizes and market conditions, then investigate persistent differences. A single bad fill is a case to examine, not proof of systematic misconduct.
Include Delays, Rejections and Unfinished Orders
Measure submission-to-first-fill and submission-to-completion separately. Report the median and a high percentile, with the sample size beside them. A single average gives little detail about the slowest orders.
Keep the denominator visible for every success statistic. “Ninety-eight percent filled” is incomplete without knowing whether it counts submitted orders, accepted orders, individual fills or requested quantity. Set a completion deadline where relevant, and explain how cancellations and outstanding orders are treated.
Rejected and unfilled requests belong in the dataset. Otherwise, the report judges only the orders that survived the process. Separate invalid requests, insufficient margin, connection failures and provider rejections where the records permit it. Leave unexplained failures marked as unexplained rather than guessing.
Use CFD order management tools to preserve acknowledgments and status changes alongside the fills. An order that failed to open exposure and an order that failed to close exposure need different treatment, even if both appear under the same error label.
Assess Stop Orders Separately
Do not pool stop orders with ordinary market submissions. A stop analysis needs at least three observations: the trigger level, the quote that activated it and the eventual execution price. Keep the activation-to-fill movement separate from any disagreement about whether activation should have occurred.
A standard stop does not guarantee execution at its trigger price. Price gaps can produce a worse fill; ASIC’s explanation of regular and guaranteed CFD stop losses illustrates that distinction. For any guaranteed order, check the actual guarantee terms and charges rather than treating the label as sufficient.
Verify the trigger side in the account terms. If a long position’s stop uses the bid, examine bid history. An ask-only chart cannot settle whether that condition occurred. Request the relevant tick records when a chart candle does not provide enough detail.
Compare Execution Cost Without Double Counting
For UK retail business within the relevant rules, best execution considers total consideration: the instrument’s price plus execution-related costs. The FCA’s COBS 11 best execution provisions, including COBS 11.2A.8 and 11.2A.9, also address checking OTC price fairness. This is a jurisdictional requirement, not a universal promise that every trade receives the best visible price.
For your own analysis, choose one cost framework. If measuring slippage against the submission ask or bid, account for spread separately. If measuring a fill against the submission midpoint, the entry-side spread cost is already included. Adding it again inflates the result.
Consider an illustrative buy where both feeds have a submission midpoint of 20,000 and the contract pays $1 per point:
Provider A quotes an ask of 20,000.5, fills at 20,000.8 and charges $1 commission. Entry cost relative to the midpoint is $1.80. Provider B quotes an ask of 20,000.7, fills at 20,000.75 and charges $0.50. Its comparable entry cost is $1.25.
Provider B wins this hypothetical comparison despite the wider entry-side spread. Neither figure includes exit costs or financing. Keep those separate, then include them when assessing the complete holding period.
Run a Repeatable Comparison
Write the test rules before collecting results. Use the same instruments, comparable exposure, sessions and order categories. Record software versions, connection changes and account settings so later results remain interpretable.
- Define the sample. Set observation dates and separate ordinary conditions from announcements and session transitions.
- Fix the measurement rules. Choose benchmarks, timestamp handling, rejection categories and the treatment of incomplete orders.
- Inspect exceptions. Review the worst fills, longest delays and missing records rather than relying only on averages.
- Repeat the comparison. Look for patterns across periods, with sample sizes and uncertainty stated plainly.
Before interpreting protective-order results, verify your stop-loss and trailing stop settings. A configuration difference can invalidate an otherwise careful comparison. Treat demo results as checks of the interface and measurement process, not proof of live execution quality.
Prefer existing trading records over placing extra trades just to enlarge the sample. If the evidence remains thin, report that limitation instead of manufacturing confidence through more risk.
Choose on Evidence You Can Recheck
Favor software that supports comparable quotes, complete order histories and repeatable calculations. Weight the findings around the way you trade: completion reliability, execution cost and behavior during your usual sessions deserve more attention than an isolated minimum spread.
Keep financing in the wider assessment. The FCA’s October 15, 2026 review of CFD pricing practices identified continuing concerns about overnight charges and their disclosure. Better execution does not remove those costs, nor does it make a leveraged CFD position safe. The aim is to identify avoidable trading friction, not confuse efficient execution with a profitable trade.