Fundamental analysis software helps investors examine a company’s financial statements, compare its operating record with peers and estimate what its shares might be worth. Its value lies in making the numbers easier to inspect, not in turning an uncertain investment decision into a certain one.
The right tool should let you trace important figures back to their origin, distinguish reported results from forecasts and change valuation assumptions without rebuilding everything. Within a broader investing software setup, this is the research layer: where you test the business case before deciding whether the price makes sense.
What Fundamental Analysis Software Should Do
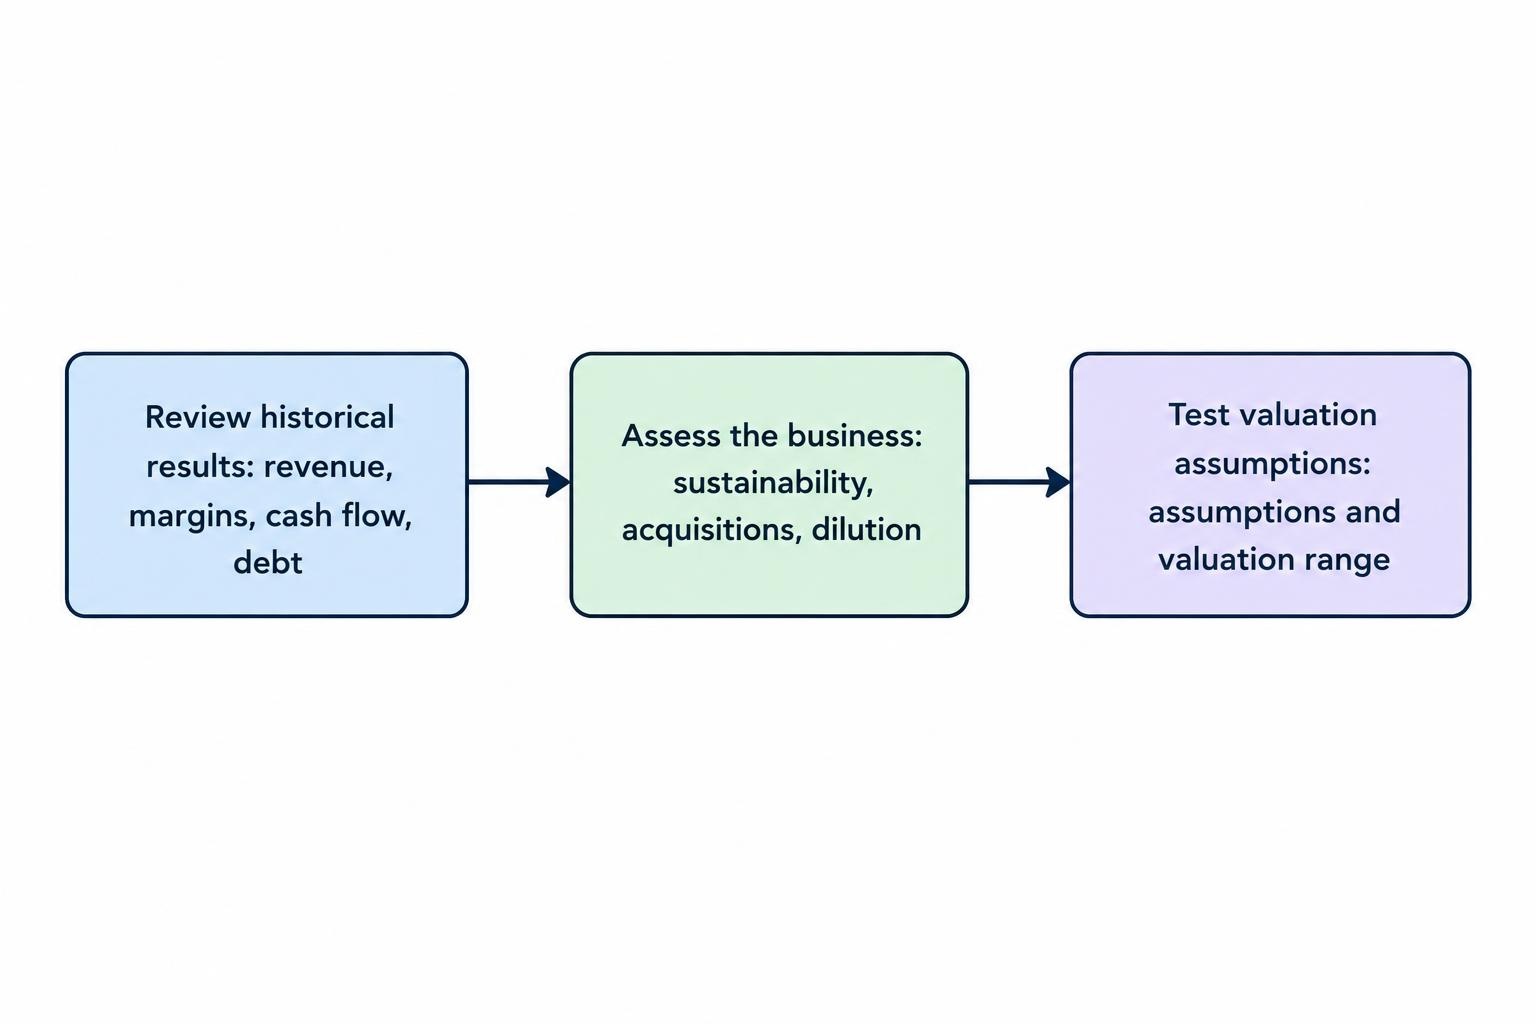
A useful platform connects three tasks: reviewing historical financial results, assessing the business behind those results and testing valuation assumptions. You should be able to move from revenue growth to operating margins, cash generation and debt without losing track of the reporting period or accounting basis.
It should also make awkward questions easier to investigate. Is profit rising faster than cash flow? Has growth depended on acquisitions? Are shareholders receiving a larger share of the business’s earnings, or has share issuance diluted the improvement?
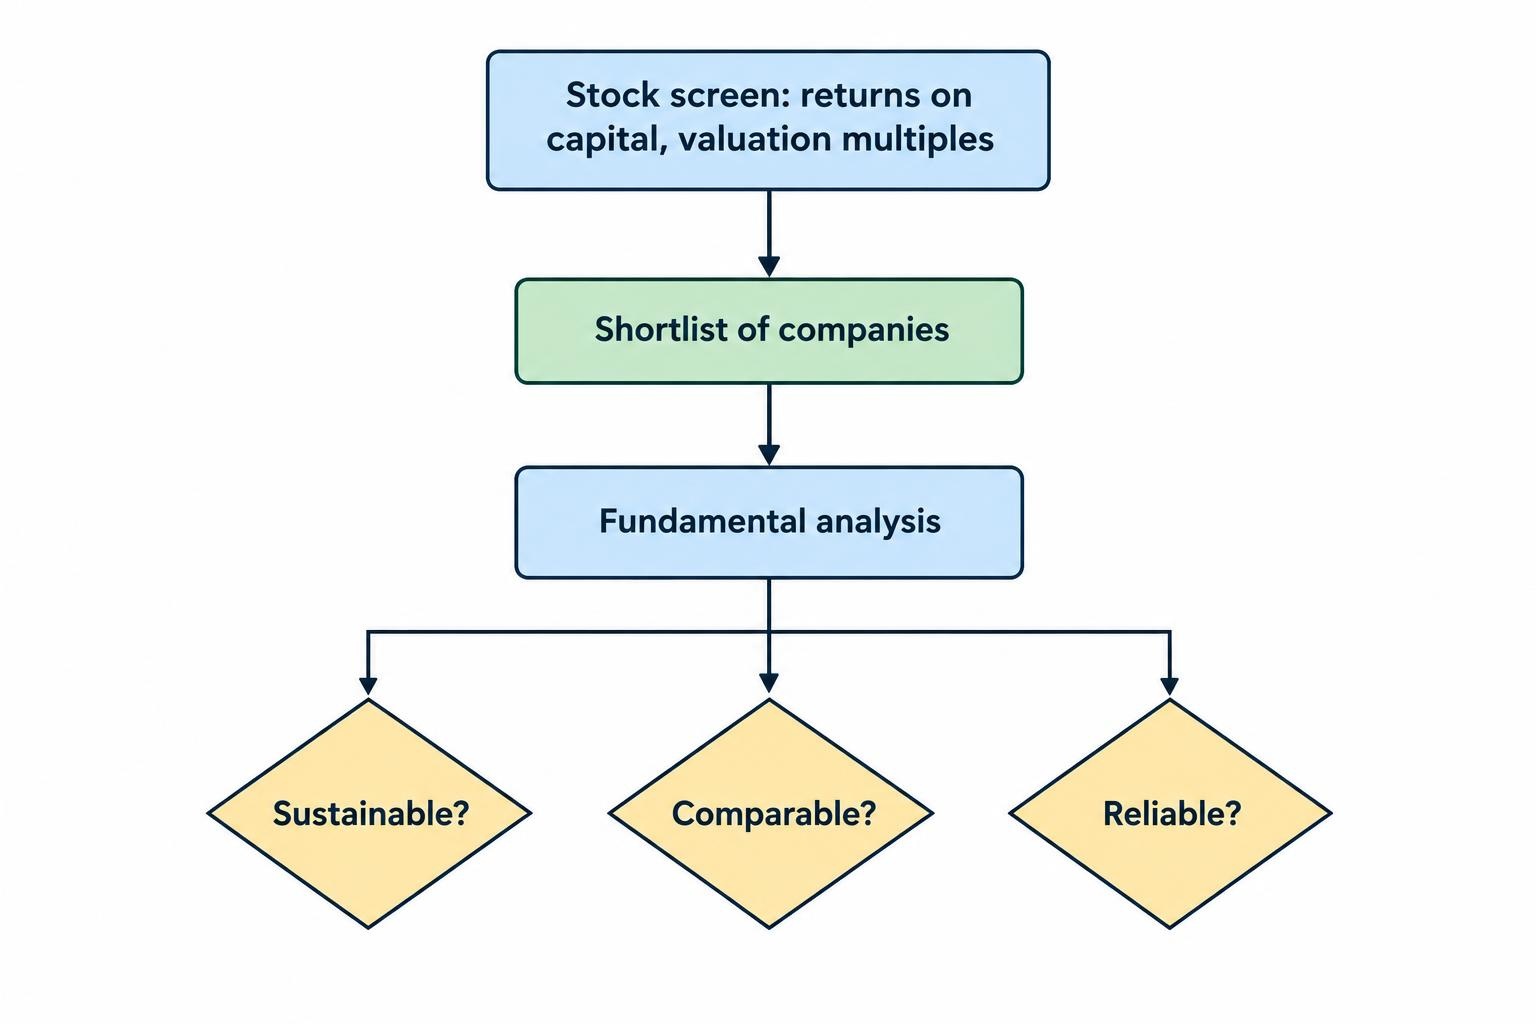
This differs from stock screening software, which narrows a universe of companies using filters. A screen might identify businesses with high returns on capital and low valuation multiples. Fundamental analysis examines whether those figures are sustainable, comparable and worth relying on.
Start With Data Quality, Not the Dashboard
Traceable financial statements
Prioritize access to the income statement, balance sheet and cash flow statement, with clear period labels and supporting definitions. For important inputs, look for a route back to the filing or disclosure. A number without an identifiable origin is a weak foundation for a valuation.
For US filing research, the SEC’s EDGAR data APIs provide company submission histories and extracted financial statement data without authentication or API keys. Their aggregated XBRL endpoints cover standard taxonomy facts applying to the whole filing entity. That makes them useful inputs, but not a replacement for reviewing disclosures outside those endpoints.
When evaluating a vendor, compare several displayed figures with the underlying report. Revenue alone is not much of a test. Add operating cash flow, capital spending and diluted earnings per share, then investigate any differences rather than assuming one display must be wrong.
Periods, currencies and units
Require visible distinctions between annual results, quarters, year to date figures and trailing twelve months. Adding overlapping periods can produce a very convincing spreadsheet with very unconvincing arithmetic.
Check whether comparisons use fiscal years or calendar years. Also separate the currency used for financial reporting from the currency of the listed shares. For companies with multiple listings or depositary receipts, confirm that the security and share basis match your valuation.
Units deserve the same attention. A table in millions and an export in thousands can create a thousandfold error without breaking a single formula. Missing values should remain visibly missing rather than quietly becoming zero.
Reported results versus adjusted measures
Software should identify whether a figure is reported under the applicable accounting standards, standardized by a data provider or adjusted for selected expenses. Those are different views of the business. Keep the distinctions visible when comparing historical results with analyst forecasts.
Free cash flow needs particular care. Operating cash flow minus capital expenditure is a common calculation, but free cash flow has no uniform definition. The SEC’s non-GAAP financial measures guidance addresses both that inconsistency and the risk of treating the result as cash freely available after every mandatory payment.
Look for calculation notes and reconciliations. If an adjusted earnings figure excludes restructuring costs, inspect the history before accepting the adjustment. An expense that returns every year deserves more scrutiny than its “one time” label suggests.
Which Type of Software Fits Your Research?
Choose the workflow before choosing the subscription. Someone researching a handful of companies may need reliable statements and a transparent spreadsheet. Someone maintaining a larger research list may place greater value on reusable comparisons and consistent data presentation.
| Approach | Useful for | Main check before committing |
|---|---|---|
| Filings and a spreadsheet | Detailed research with direct control over assumptions | Time required to collect, reconcile and update inputs |
| Financial statement research platform | Reviewing several companies using consistent layouts | Coverage, accounting definitions and historical depth |
| Dashboard led research platform | Comparing financial trends and market expectations visually | Whether the displayed metrics answer your research questions |
| Structured data service | Repeatable models and automated research processes | Documentation, usage rights and handling of revisions |
TIKR for financial statement review
TIKR’s Detailed Financials view includes income statements, balance sheets, cash flow statements and ratios. It also supports charting financial rows and adding other tickers for comparison. Those functions are documented in its financial statement research instructions.
Consider this approach if your process starts with reading several years of statements before building a valuation. During evaluation, use companies you already know and check the rows that matter to your research. Do not judge coverage by whether a ticker appears in search; check whether its financial history contains the detail you need.
Koyfin for comparing actual results and forecasts
Koyfin’s Actuals and Consensus view places historical financial results alongside analyst estimates, with settings for fiscal or calendar periods and additional consensus information. Much of the data in this view is adjusted, while unadjusted items are labeled GAAP.
Consider this approach when your research question is about expectations: what level of growth or profitability would justify the price? Inspect the number of contributing analysts and the range of estimates rather than relying only on the average. Treat consensus as a reference point to challenge, not a forecast you must adopt.
Valuation Features Worth Having
A valuation module should expose its assumptions. Look for editable growth rates, margins, reinvestment requirements, discount rates and share counts. Require separate downside, central and upside cases rather than a single price presented with excessive precision.
A spreadsheet remains useful for this work because the model can be inspected and altered. Aswath Damodaran’s NYU Stern valuation spreadsheets include editable Excel models covering different valuation approaches and business types. They provide a practical reference when assessing whether a software model gives you enough control.
For discounted cash flow analysis, keep the cash flow definition consistent with the valuation method. A model valuing the operating business is not interchangeable with one valuing cash flows directly available to equity holders. Check how the software moves from business value to equity value and then to value per share.
For peer comparisons, require clear definitions of earnings, debt and enterprise value. A low multiple is a starting question, not an answer. Ask whether the company deserves a different valuation because its growth, capital requirements or financial risk differ from the selected peers.
Sensitivity tables are especially useful. They show whether a valuation survives modest changes in assumptions or depends on everything going right. A model that cannot tolerate an ordinary disappointment is telling you something worth hearing.
A Practical Example: Testing Earnings Quality
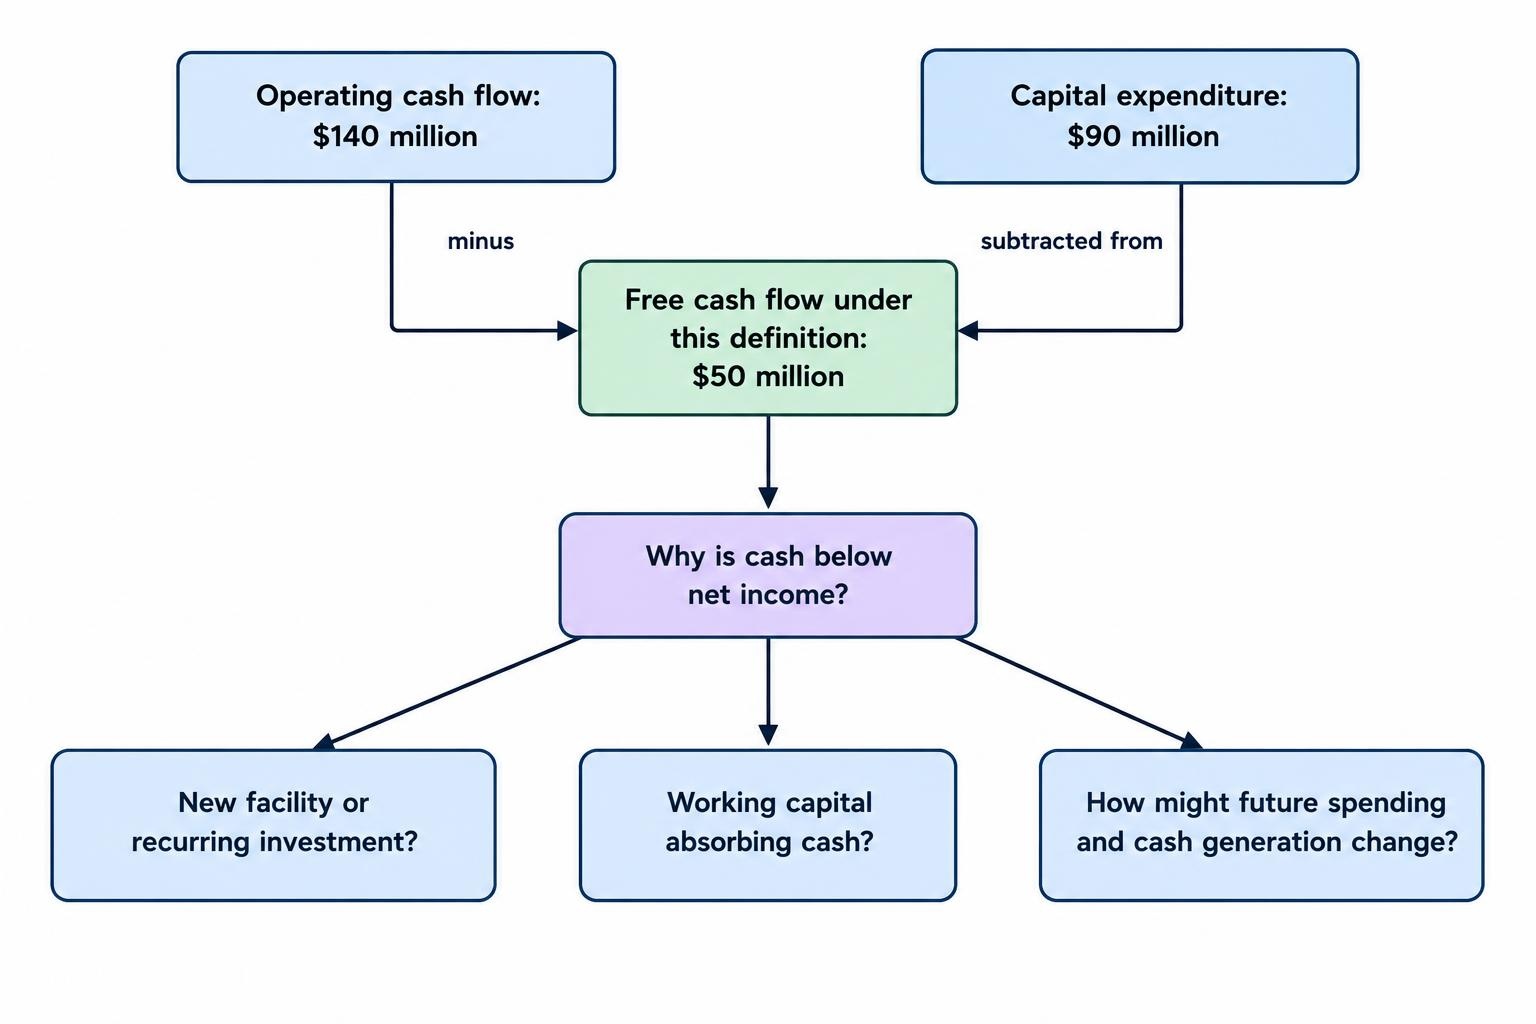
Consider a hypothetical manufacturer with annual revenue of $1 billion, net income of $100 million, operating cash flow of $140 million and capital expenditure of $90 million. Using operating cash flow minus capital expenditure, free cash flow would be $50 million.
Assume its equity market value is $2 billion. The price to earnings ratio is 20, while the price to free cash flow ratio under that definition is 40. Both calculations are correct, but they direct attention to different questions.
The next step is not to decide that one ratio reveals the “real” valuation. Use the software to examine why cash remaining after capital spending is below net income. Is the company building a new facility? Does it regularly need this level of spending? Has working capital absorbed cash?
Review several periods and record the explanation. Then test alternative assumptions about future spending and cash generation. Do not substitute the simple free cash flow figure into a valuation model that requires a different cash flow measure.
The useful software feature here is the ability to move between statements, supporting disclosures and your assumptions. A green score beside the company’s name would not resolve any of those questions.
When Is Paid Fundamental Analysis Software Worth It?
Pay for a research bottleneck you can identify. Longer financial history may help you assess a cyclical business. Broader geographic coverage may matter for an international peer group. Reusable comparisons may be valuable if you review many companies using the same framework.
Before subscribing, test access to your actual research list. Check historical depth, quarterly detail, estimate coverage, export permissions and the ability to retain your own notes. Treat these as separate requirements: seeing data on screen does not establish that your subscription permits downloading or reusing it.
Calculate the annual cost, including taxes and any separate data charges, against the work you expect it to replace. More charts are not a saving if you still have to collect every valuation input elsewhere.
Account connectivity is another separate decision. Company research does not require permission to place trades. If you want holdings imported, review the access requested and the disconnection process using the guidance on connecting investing software to brokerage accounts. Avoid granting permissions that serve no purpose in your research process.
Test the Software With One Complete Research Task
A useful evaluation follows a company from its filing to a written investment case. Use the same task across competing tools so that differences in presentation do not distract from differences in usefulness.
- Reconcile the inputs. Check selected statement figures, dates, currencies and units against the company’s disclosures.
- Investigate an adjustment. Identify what separates reported earnings from the adjusted measure you plan to use.
- Build a valuation range. Change assumptions and check that the outputs respond as expected.
- Save the work. Confirm that you can preserve notes, assumptions and permitted exports in a usable format.
Include an awkward case: a loss making company, a recent acquisition or a business with uneven cash flow. You want to know how the platform handles uncertainty, not just how neatly it displays a straightforward income statement.
If you use automated summaries, require links to the underlying passages and verify material figures yourself. Use the summary to locate evidence, not to replace it.
Keep the Research Record Separate From Investment Returns
Save the date, source documents, assumptions and valuation range behind each decision. At the next review, compare actual results with the business case you recorded rather than rewriting the original expectations from memory.
Measuring what your investment earned is a different task, covered by portfolio performance analysis tools. Keeping that distinction clear helps you assess both the research and the outcome.
Choose fundamental analysis software that makes evidence easier to check and assumptions harder to hide. It should help you reach a defensible decision, including the decision that the available evidence is not strong enough to invest.